Engineering Projects – The critical path
Updated: Jul 12, 2022
Following on from our last article on engineering projects – planning for success (catch up here), this article expands on project management to discuss the importance to any project manager of knowing how to find the project critical path, and why it is so useful.
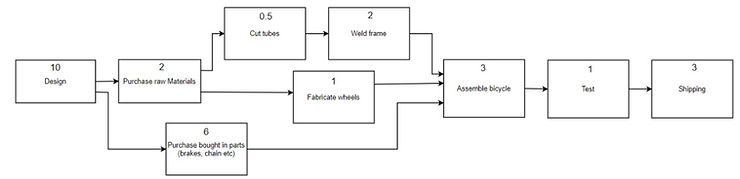
Critical path analysis is a technique for planning and scheduling a project. Let’s take a simplified project for designing and manufacturing a bicycle. Some of the main project activities can be shown in a network diagram as per below.

Critical path flow-chart
Notice how the project runs from left to right, and some activities can be done in parallel (e.g. making the frames, and fabricating the wheels) whilst some activities cannot start until the previous ones have finished (e.g. purchase of parts cannot start until the Design activity has finished).
Our role as the project manager is to understand which activity must start first, how much slack or ‘float’ each activity has, and ultimately determine the critical path for this project.
So, the first job to do is to add how long each activity will take (the task duration), this has been added in as the number of days in the top centre of each box:
(I suggest you copy out the below diagram and work along with the rest of this article).
Critical path flow-chart
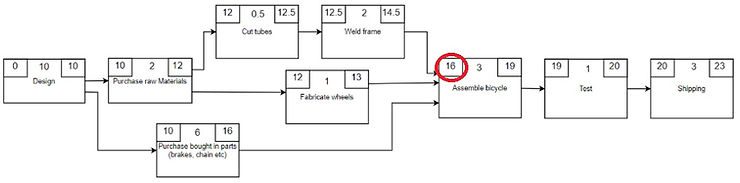
Earliest Start Time (EST) – The next piece of information we will add to the diagram is something called the Earliest Start Time (EST). This details the earliest possible time that each task can start, given the duration of the tasks that must have already been completed. This is shown on the top left of each box in our diagram below.
Earliest Finish Time (EFT) – Similarly, the Earliest Finish Time is simply the earliest time each task can be finished given its start time and the duration to complete the task.
It can be written as EFT = EST + Task Duration. This number is written in the top right corner of each box.
Assuming we start the project on ‘day 0’, our network diagram would now look like this:
Critical path flow-chart
Notice how the earliest start time for each activity is the same as the highest finish time for the previous activities. E.g. The bicycle assembly cannot start until day 16 as this is the latest finish time of the 3 tasks that feed into it.
Doing this ‘forward’ pass of working left to right we have determined our earliest possible project finish time, 23 days.
Backwards Pass
Now, let’s consider we work backwards from our earliest project finish time. The purpose for doing this is to identify any slack within the activities, i.e. some of these activities could start later than the earliest start time without affecting the overall project.
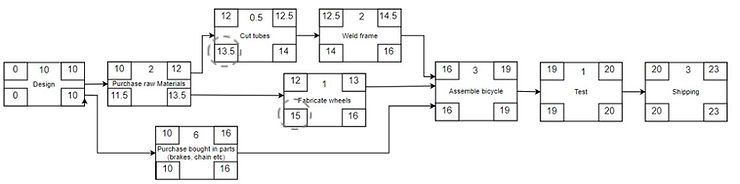
Latest Finish Time (LFT) – The latest finish time is the latest that each task could finish without affecting the overall project.
We know the project should finish in 23 days, so we start by putting that as the latest finish time for the final (shipping) task.
The latest finish time is written in the bottom right of each box:

Task box
Latest Start Time (LST) – If we now start to work right-to-left (i.e. backwards) through our network, we can easily find the latest start time for each task. I.e. the latest time that any task can start without affecting the overall project. This is simply found by working backwards, i.e. LST = LFT – task duration.
The latest start time is written in the bottom left of each task box, so for ‘shipping’, the latest start time is day 20.

Task box
Working backwards through the diagram we can start to calculate the latest finish and therefore the latest start time for each activity, see the diagram below:
Critical path flow-chart
Let’s take a look at the activity ‘Purchase raw materials’. The two tasks following this are ‘cut tubes’ and ‘fabricate wheels’, but these both have different latest start times. In these instances you need to take the lowest of the latest start times. That’s because we need to finish the task ‘purchase raw materials’ to ensure we can start the task ‘cut tubes’ before the latest possible start time.
Slack
Now that we have all this information, what can we do with it?
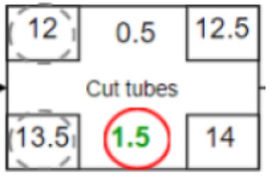
Well for each task we can now easily calculate the slack or float available in that task. We can do this simply by looking at the difference between the earliest and latest start times for each task. That is Slack = LST – EST. We can write this number in the bottom centre of the box for each task.
Task box
slack = 13.5 – 12 = 1.5days
If we do that for our full process, we get:

Critical path flow-chart
What we have now identified in red is the Critical Path (that is, activities which have zero slack). In other words, all those tasks that have zero slack must be started on time in order for our project to keep to the schedule. If any of these items overrun, we know it will have a knock-on effect to the whole project.
Conversely, for the tasks not on the critical path, we have identified how much slack or float there is to start that task. E.g. Let’s look at the task ‘fabricate wheels’ in our project. This task has 3 days of slack, so we can start that task anytime between day 12 (EST) and day 15 (LST) and it won’t affect the overall project plan.
By identifying the critical path we now know which tasks we must prioritise and ensure they stick to schedule. In a real world example, let’s say we have some staff sickness, and we only have 1 Purchasing staff. It’s clear that in this example, they should concentrate on purchasing the bought in parts (brakes, chain etc) before they purchase the raw material because the ‘bought in parts’ are on the critical path.
Practise
Why not try creating the network diagram and identifying the critical path for our cup of tea example in the previous article (here). The tasks should match those on the Gantt chart. Don’t forget, for each task on the diagram to add the information as per below;

Interested in electrical and electronic engineering? Find out more about all the electrical engineering courses we have available by clicking here.
Diploma in Electrical Technology
Diploma in Renewable Energy (Electrical)
Diploma in Electrical and Electronic Engineering
Alternatively, you can view all our online engineering courses here.
Recent Posts
Civil Engineering Courses and Diplomas: Topics, Skills and Career Routes
Civil Engineering Courses and Diplomas: Topics, Skills and Career Routes Introduction Civil engineering is the backbone of modern society. From roads and bridges to skyscrapers and water systems, civil engineers design, build, and maintain the infrastructure that keeps the world running. If you’re considering a civil engineering course or diploma, understanding what it covers is […]
What Is a Diploma in Engineering? Courses, Levels and Career Routes Explained
What Is a Diploma in Engineering? Courses, Levels and Career Routes Explained Introduction Engineering shapes the world around us, from the buildings we live in to the technology we use every day. But for many aspiring engineers, the biggest question is not whether to pursue engineering, but how to start. Traditional university degrees are not […]
Engineering Courses: How to Choose the Right Route for Your Career
Engineering Courses: How to Choose the Right Route for Your Career Introduction Choosing an engineering course can feel like standing at the beginning of several different roads, each leading towards a different kind of future. One route may lead into mechanical systems and manufacturing. Another may lead towards aircraft, infrastructure, electronics, computing, renewable energy or […]