Understanding Value Stream Mapping in Manufacturing
Introduction
A process flow can be visualised, and improved using the aid of a visual tool called value stream mapping.
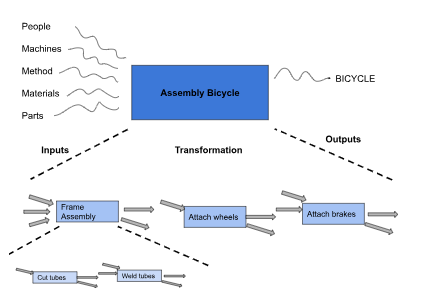
For any manufacturing system, there will be inputs to the process and there will be outputs to the process. And at some point there will be some ‘activity’ or some work done to change the inputs into the outputs. E.g. machining, assembly, welding, joining etc.
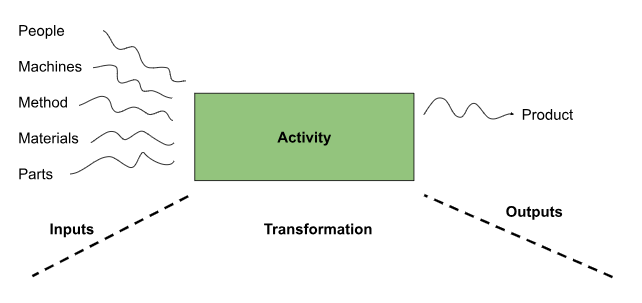
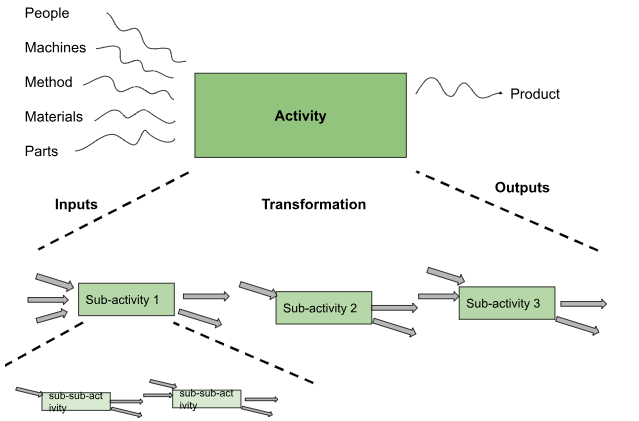
Within that ‘transformation’ stage (where work is done) there is likely to be a number of ‘sub-activities’ that take place:
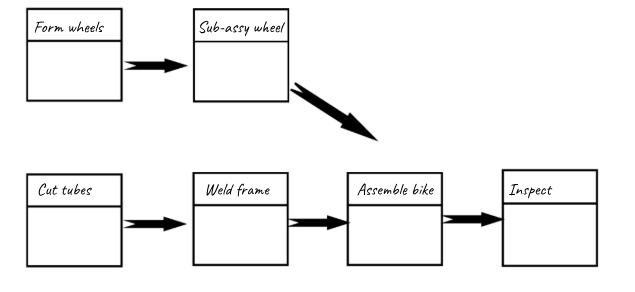
For example if we imagine a factory that makes bicycles:
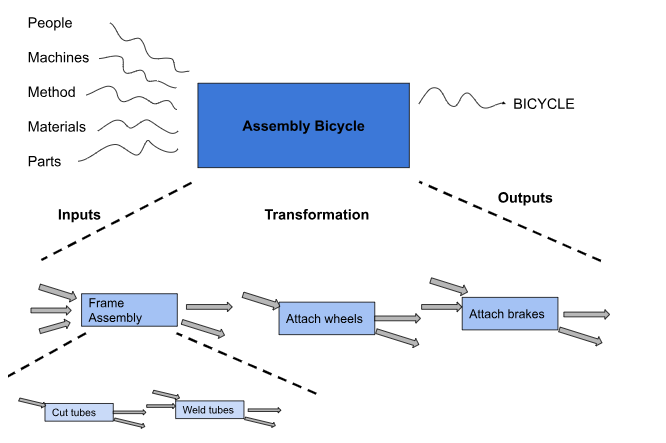
Even in this very simple example, you can see how you can visualise and draw a ‘map’ of the different process steps, and how they would fit together inside the factory.
This tool will enable you to draw a picture of any process which then enables you to identify sources of WASTE i.e. non-value added operations in the process.
Instead of reading about a journey, you can actually see it as you would by looking at a road map.
Process Mapping, Why?
Process mapping is a very common tool within manufacturing environments. Below are some of the reasons why it is used so extensively:
- It helps you to visualise more than just a single process (i.e. you can see how a chain or processes or systems fit together)
- It helps to identify the sources of waste
- It shows the linkage between information flow and material flow
- Decision making for flow changes can be seen on paper and hence are simplified
- It provides a common language for all processes
- It starts you on the road to becoming a fully integrated lean manufacturing plan.
Process Mapping – The Method
In order to create an accurate map of the process you should:
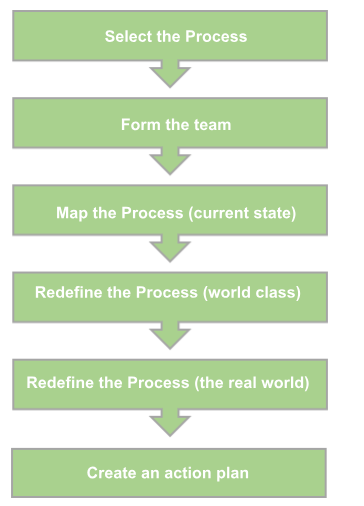
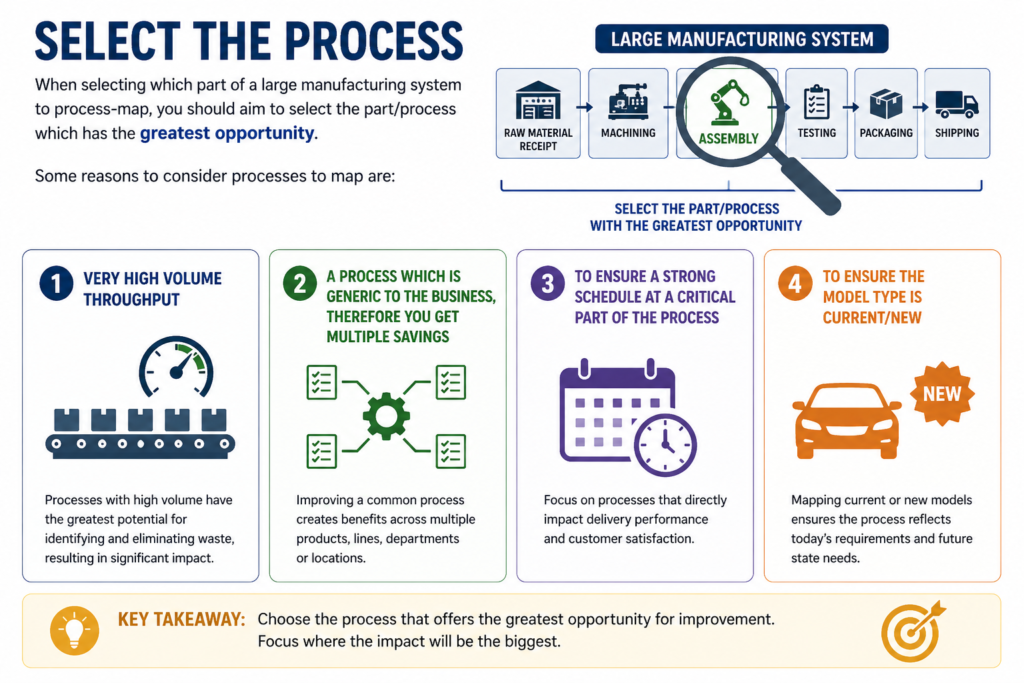
Select the Process
When selecting which part of a large manufacturing system to process-map, you should aim to select the part/process which has the greatest opportunity. Some reasons to consider processes to map are:
- Very high volume throughput
- A process which is generic to the business, therefore you get multiple savings
- To ensure a strong schedule at a critical part of the process
- To ensure the model type is current/new
Form a Team
In a real industrial environment, process mapping should not be done by a single person, or as a ‘desk-top’ exercise. It should be performed by a team of people who must come from inside the process (the real experts!) That is, it should contain the operators and engineers who work directly on the manufacturing line each day.
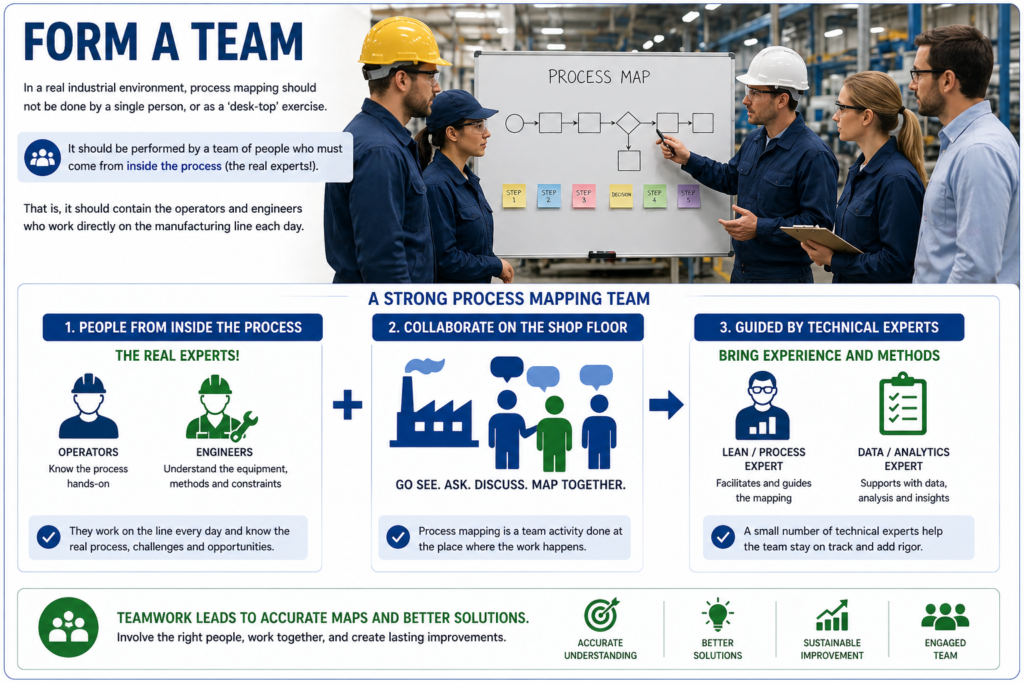
The team should then be re-informed with a small number of technical experts who can help to guide them through the process-mapping process.
Map the Process (Current State)
As per above, mapping the process should not be a ‘desk-top’ exercise. By that, we mean it should not be done sitting within an office, but instead performed by physically walking (where possible) the production line and following the flow of the parts.
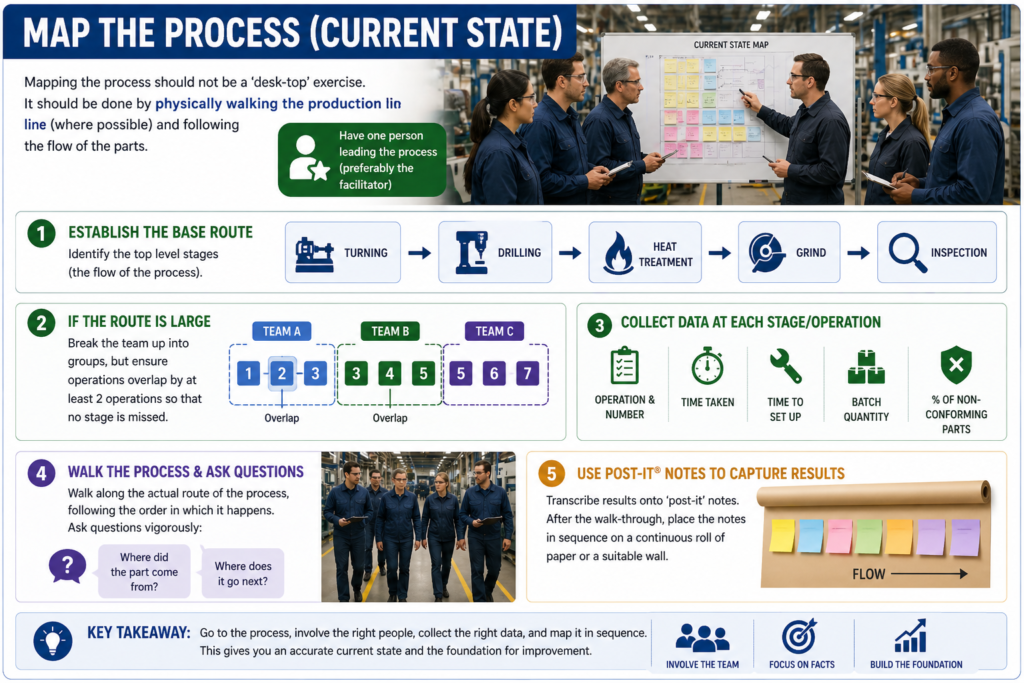
- You should have one person leading the process (preferably the facilitator)
- Next Establish the base route, that is the top level stages of the process for example:
Turning -> Drilling -> Heat treatment -> Grind -> inspection
- If the route is large, break the team up into groups but ensure operations overlap by at least 2 operations so that no stage is missed
- Each team should then collect data at each stage/operation, such as:
- Operation & Number
- Time taken
- Time to set up
- Batch quantity
- % of non-conforming parts
As mentioned, the team should actually walk along the route of the process, following the order of which it happens. As you go, the team should ask questions vigorously, such as “where did the part come from?”, “where does it go next?”
Good practise is to transcribe results onto ‘post-it’ notes. Following the walk-through, this then allows you to place the notes in sequence on a continuous roll of paper or a suitable wall.
A simple example of the output is shown below:
Redefine the Process
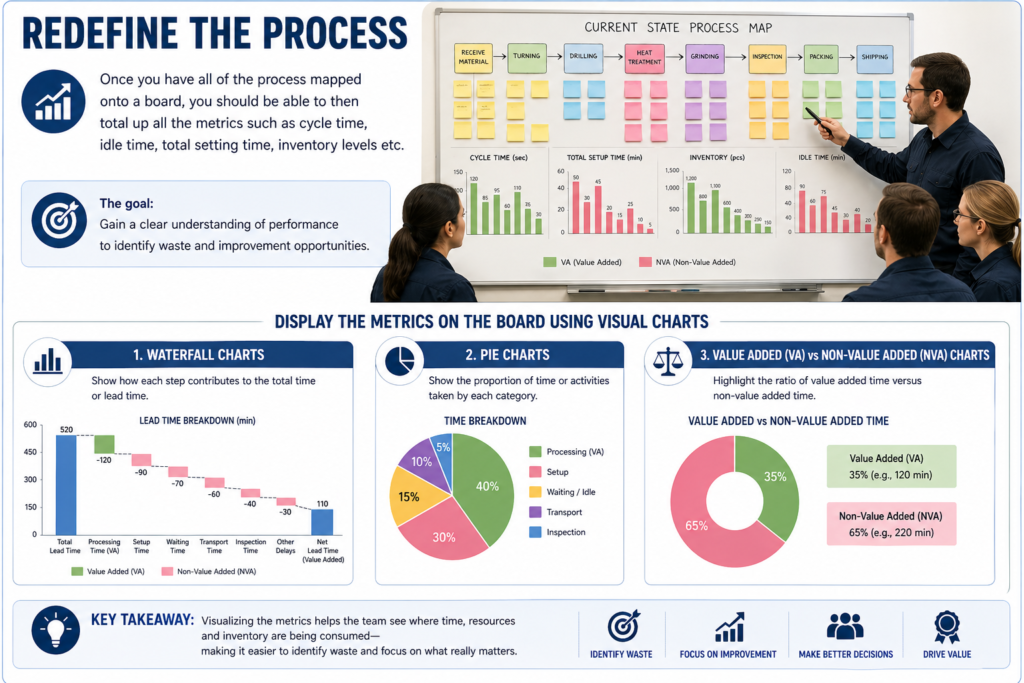
Once you have all of the process mapped onto a board, you should be able to then total up all the metrics such as cycle time, idle time, total setting time, inventory levels etc.
These should be displayed on the board as a series of charts, such as:
- waterfall charts
- Pie charts
- Value added (VA) vs non-value added (NVA) charts
The next stage is to assess the process for the ‘world’s best’, that is to aim for the ultimate goal of zero waste, zero non-value added time/operations etc.
To do this, ask questions such as “which operations are truly adding value in the eyes of the customer?”
You should then re-display these charts showing the best possible process regardless of cost or time constraints.
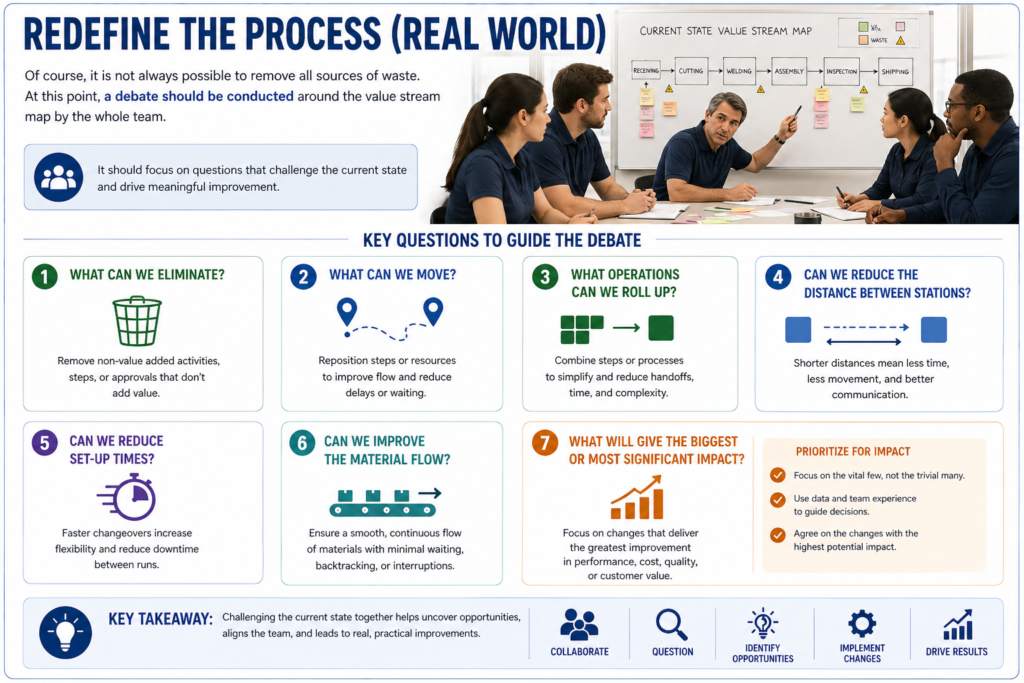
Redefine the Process (Real world)
Of course, it is not always possible to remove all sources of waste. At this point, a debate should be conducted around the value stream map by the whole team. It should focus on questions such as:
- What can we eliminate?
- What can we move?
- What operations can we roll up?
- Can we reduce the distance between stations?
- Can we reduce set-up times?
- Can we improve the material flow?
- What will give the biggest or most significant impact?
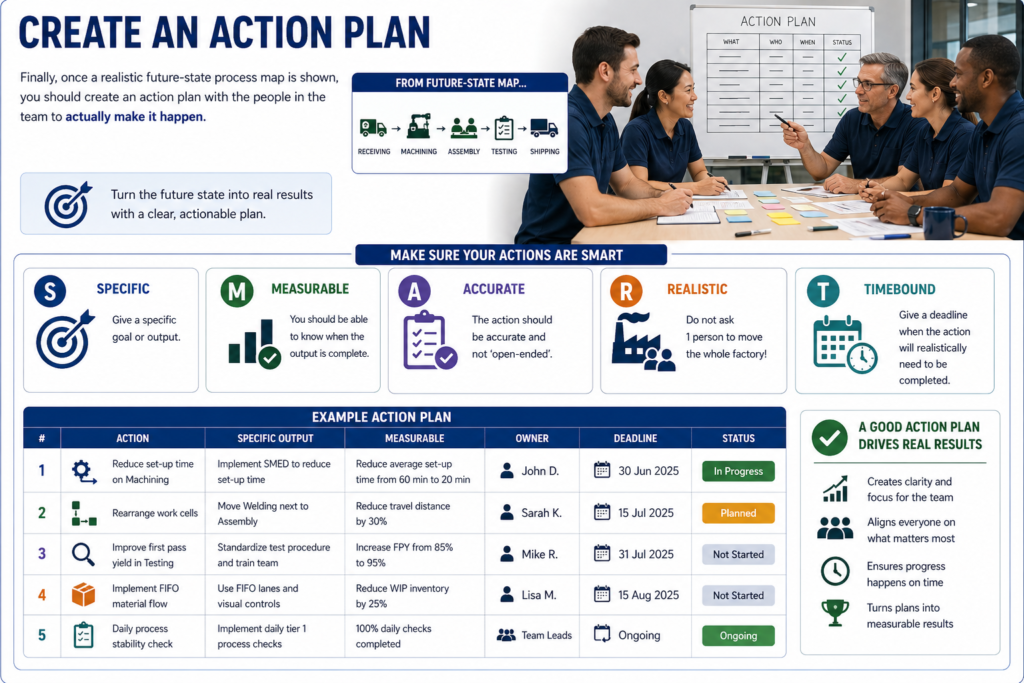
Create an action plan
Finally, once a realistic future-state process map is shown, you should create an action plan with the people in the team to actually make it happen.
The actions should all be SMART, that is they should be:
Specific – Give a specific goal or output
Measureable – You should be able to know when the output is complete
Accurate – The action should be accurate and not ‘open-ended’
Realistic – Do not ask 1 person to move the whole factory!
Timebound -Give a deadline when the action will realistically need to be completed
Process Mapping, How to Draw them?
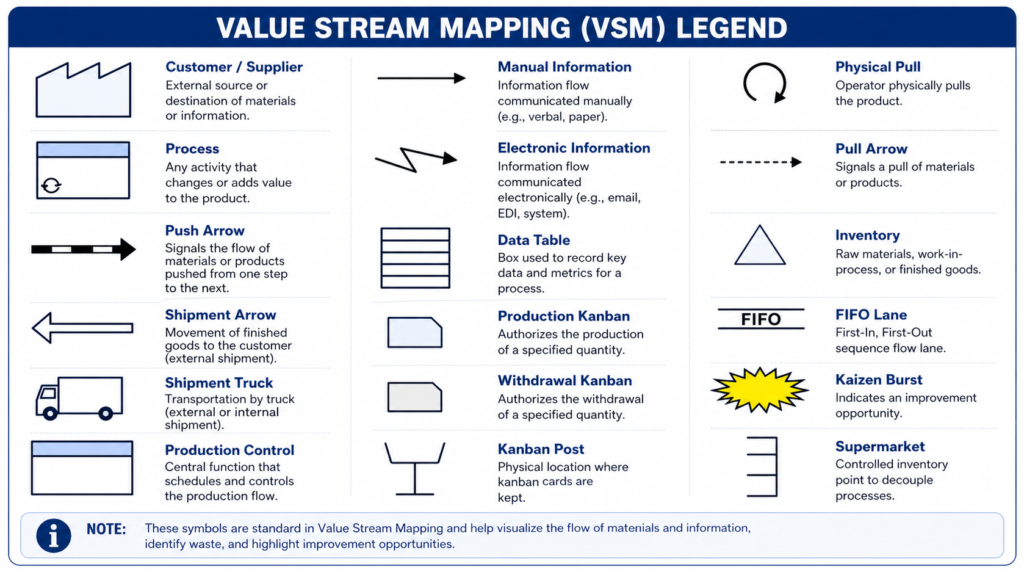
Unlike our earlier messy example of a simple bicycle assembly, there is actually a formal method and set of symbols used to create a process map. (not just boxes and squiggly lines!)
Using a common international set of symbols means that we are all speaking the same language when it comes to creating a value-stream map. Once you know the symbols you can read the map for any manufacturing system across the world, and understand how it works.
These symbols were defined in Rother and Shook: Learning to see and are widely used throughout the manufacturing industry.
The key symbols are:
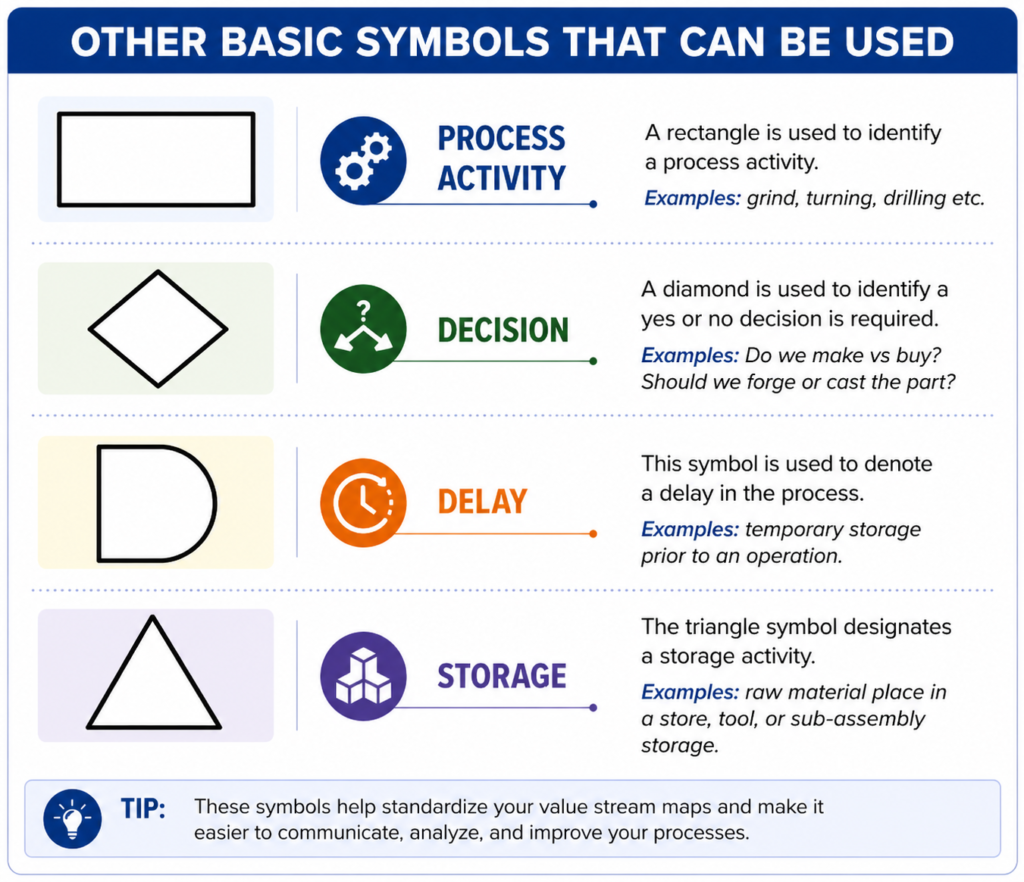
Other basic symbols that can be used are:
Now that we have our basic set of symbols, we can follow the steps below to see how a basic value-stream map can be developed in stages:
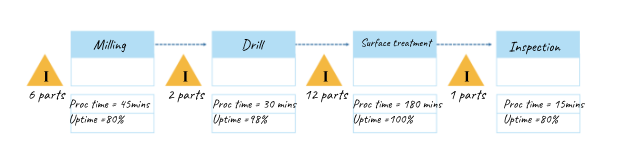
Step 1: View of current state map, showing just the main stages
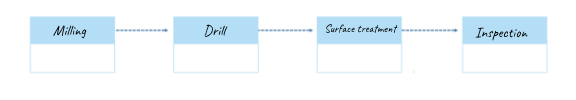
Step 2: Add in process details (data boxes), plus inventory levels:
Step 3: Add in part material flow (suppliers + customers), plus add the total cycle and process time
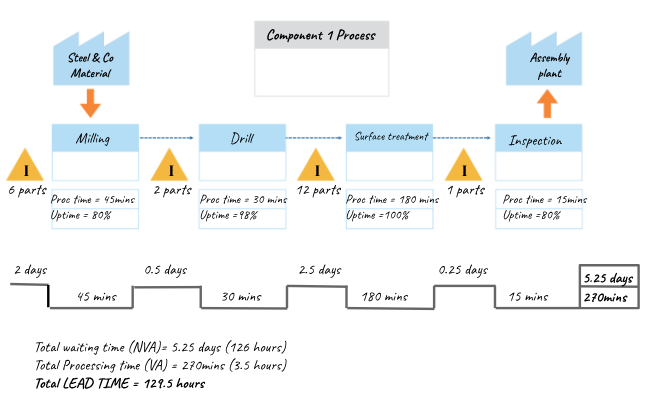
Even on this basic example, we can start to view some very interesting information on the process.
We can see total waiting times, and process times. And therefore calculate the % value added time. (3.5 hours / 129.5 hours = 2.7%).
Furthermore, we can see the total amount of Inventory (which is a form of waste, and therefore cost) is held up within the process (6 parts + 2 parts + 12part + 1part = 21parts).
And finally, you can start to read the story of how the process is working; for example we can see that there is a long delay waiting for ‘Surface treatment’ (2.5 days = 46% of the whole process-time!). That tells us that surface treatment is a bottleneck in the process, and would be a good area to look for improvements in order to reduce our overall cycle time.
Interested in our Industrial & Manufacturing Engineering Courses?
At iLearn Engineering®, we offer a diverse range of online accredited Industrial, Manufacturing and Mechanical Engineering courses and qualifications to cater to different academic and career goals. Our industrial courses are available in varying credit values and levels, ranging from 40 credit Engineering Diplomas to a Bachelor’s equivalent 360 credit International Graduate Diploma.
All Industrial / Manufacturing Engineering Courses
All Industrial / Manufacturing Engineering Diploma Courses can be seen here.
All Mechanical Engineering Diploma Courses can be seen here.
Short Courses for Industrial Engineering (40 Credits)
- Diploma in Manufacturing
- Diploma in Composites, Smart Materials & Nanotechnology
- Diploma in Lean Manufacturing
- Diploma in Mechanical Technology
- Diploma in Electrical Technology
- Diploma in Material Science
First Year of Undergraduate (Level 4 – 120 Credits)
Higher International Certificate in Industrial Engineering
Higher International Certificate in Mechanical Engineering
Years One and Two of Undergraduate (Level 5 – 240 Credits)
Higher International Diploma in Industrial Engineering
Higher International Diploma in Mechanical Engineering
Degree Equivalent International Graduate Diplomas in Engineering Management and Mechanical Engineering (Level 6 – 360 Credits)
International Graduate Diploma in Engineering Management (Level 6) [120 Credit Top Up]
International Graduate Diploma in Mechanical Engineering (Level 6) [120 Credit Top Up]
Complete Engineering Course Catalogue (all courses)
Alternatively, you can view all our online engineering courses here.
Get started today
Explore our range of Industrial and Manufacturing Engineering courses
Recent Posts
Understanding Key Performance Indicators in Manufacturing
Understanding Key Performance Indicators in Manufacturing Introduction Key Performance Indicators (KPIs), or sometimes written as Key Performance Measures, are some of the key ‘metrics’ that are used to measure the performance of an industrial system. A good KPI for a manufacturing system should be SMART, that is: Specific – It should measure a specific output […]
How Aircraft Structures Evolved: From Fragile Flyers to Engineering Masterpieces
How Aircraft Structures Evolved: From Fragile Flyers to Engineering Masterpieces Introduction As with all other aspects involved with an aircraft, the structural design and layout has changed markedly over the history of flight, in line with technological advances and new discoveries. This section will highlight some of the more substantial developments made during the history […]
Why Lean Manufacturing Matters: Principles of waste
Why Lean Manufacturing Matters: Principles of waste Introduction Lean manufacturing isn’t just a toolkit for improving efficiency, it’s a mindset that reshapes how organisations think about value. At its core, lean focuses on delivering exactly what the customer needs, when they need it, with as little waste as possible. In an increasingly competitive and resource-conscious […]