Trigonometric representation of periodic wave forms
While we’ve already looked at periodic wave forms in a previous article, we’re going to jump into the trigonometric representations and see some of the essential calculations we need.
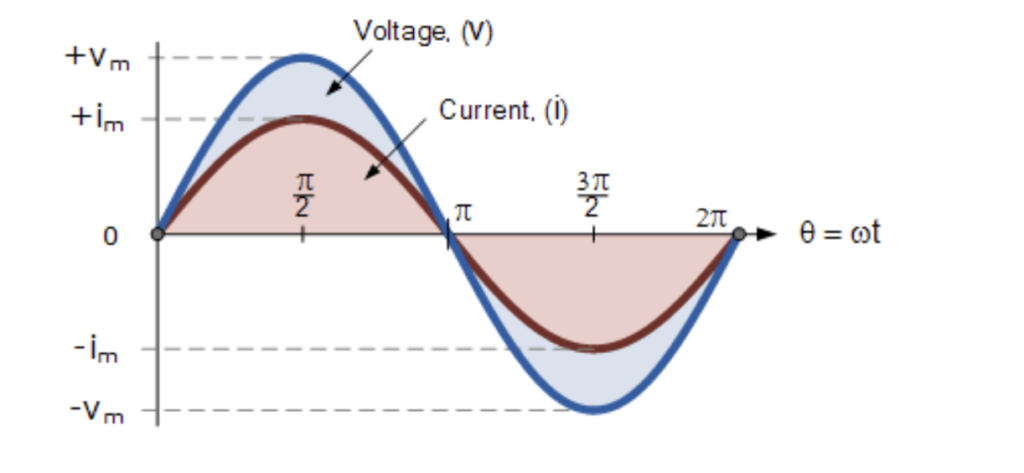
Before we jump in, just to refresh our memory, let’s look at an image of two sinusoidal waveforms ‘in phase’:
Phase difference of a sinusoidal waveform
Let’s imagine we have a phase difference of 30º (Φ = 30o or π/6 radians). The two will have the same frequency, and so the phase difference will remain constant. You can see a graph representation in the image below:
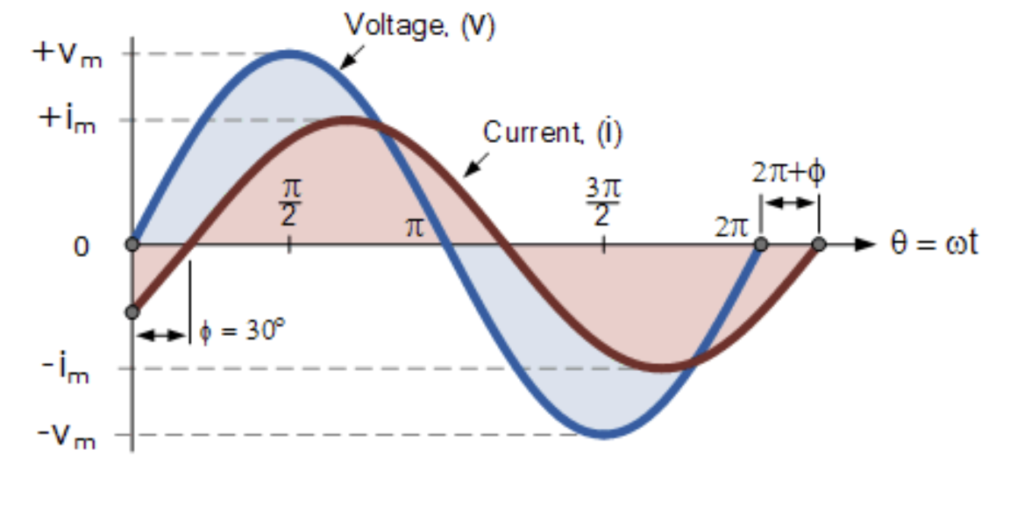
When the voltage waveform starts at zero, the current waveform is still negative. It will cross the reference axis 30º later, meaning there is what we call a phase difference.
As these two waveforms are no longer “in-phase,” they are referred to as “out-of-phase” by phi, Φ. In our example, this is 30o. The current waveform is lagging behind the voltage waveform by the phase angle.
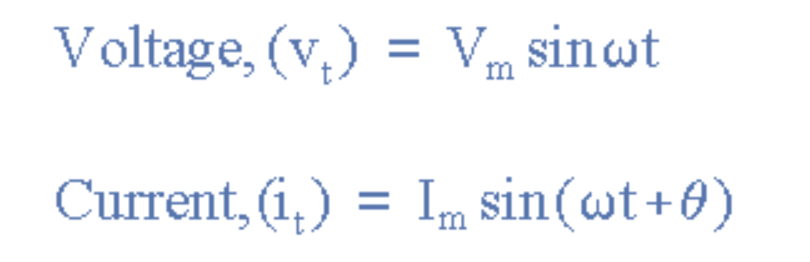
So in our example above, these two waveforms have a lagging phase difference. The expression for both the voltage and current above will be:

where, i lags v by angle.
Leading Phase Difference
The expression for the leading phase difference for the voltage and current in our example is:
where, i leads v by angle Φ.
We can describe our first example as lagging by 30º and the second as leading by 30º. While the relationship between the two waveforms and the phase angle can be measured anywhere along the horizontal zero axis, it is easier to use the zero values.
In AC power circuits, this ability to describe the relationship between a voltage and current sine wave within the same circuit is very important and forms the basis of AC circuit analysis.
Phasor Diagrams and Phasor Algebra
Phasor Diagrams are a graphical way of representing the magnitude and directional relationship between two or more alternating quantities.
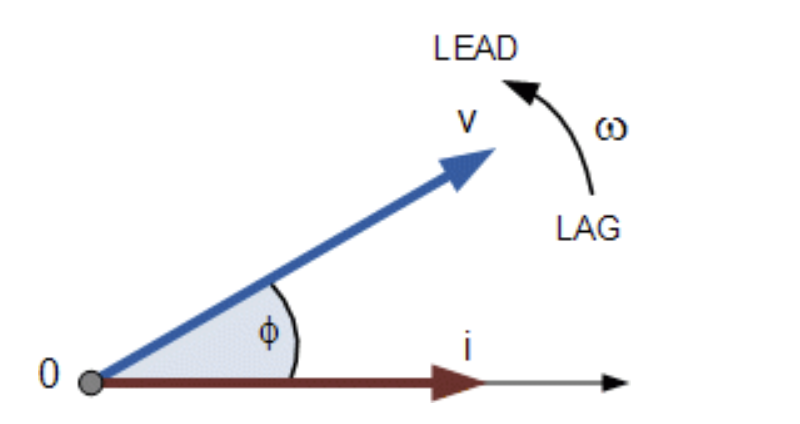
Basically, a rotating vector, simply called a phasor, is a scaled line with an arrow on one side. It’s length represents an AC quantity that has both magnitude (“peak amplitude”) and direction (“phase”) and is frozen at some point in time.
Normally, we draw our first vector horizontally and rotate from a fixed point in an anti-clockwise direction at an angular velocity of one full revolution for every cycle. This anti-clockwise rotation is considered to be a positive rotation, whereas a clockwise rotation is considered to be a negative rotation.
A complete sine wave can be constructed by a single vector rotating at an angular velocity of ω = 2πƒ, where f is the frequency of the waveform.
Generally, when constructing a phasor diagram, angular velocity of a sine wave is always assumed to be ω in rad/sec.
Phasor Diagram of a Sinusoidal Waveform
Let’s imagine the current, I, is lagging the voltage, v, by angle Φ, which in our example above is 30º. The difference between the two phasors representing the two sinusoidal quantities is angle Φ and the resulting phasor diagram is:
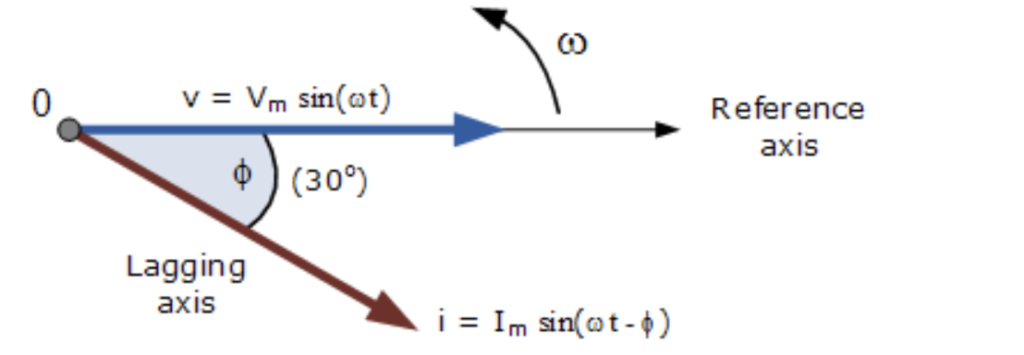
The phasor diagram is drawn corresponding to time zero (t = 0) on the horizontal axis. The lengths of the phasors are proportional to the values of voltage and current at the instant in time that the phasor diagram is drawn.
The current phasor lags the voltage phasor by the angle, Φ, as the two phasors rotate in an anticlockwise direction; therefore, the angle, Φ is also measured in the same anticlockwise direction.
If we imagine the waveforms are frozen at time, t = 30o, the corresponding phasor diagram would look like the one shown below:
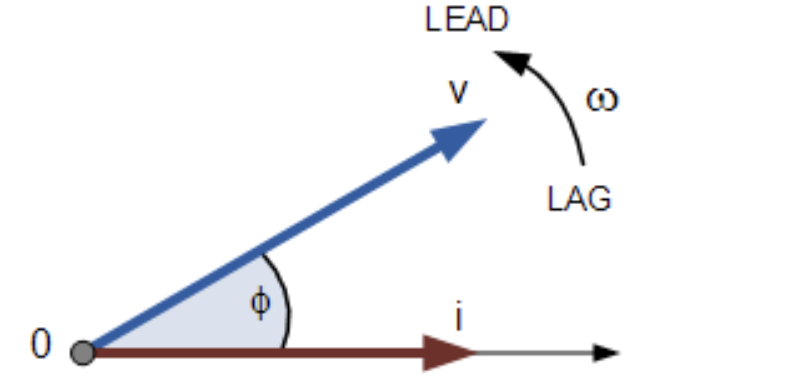
Once again, the current phasor lags behind the voltage phasor as the two waveforms are of the same frequency.
However, as the current waveform is now crossing the horizontal zero axis line at this instant in time, we can use the current phasor as our new reference and correctly say that the voltage phasor is “leading” the current phasor by angle, Φ. Either way, one phasor is designated as the reference phasor and all the other phasors will be either leading or lagging with respect to this reference.
Phasor Addition
Adding voltages that are in phase is as simple as adding the values together. For example, if two voltages of say 50 volts and 25 volts, respectively, are “in-phase”, they will add or sum together to form one voltage of 75 volts (50 + 25).
If, however, they are not in-phase, that is, they do not have identical directions or starting points, then the phase angle between them needs to be taken into account so they are added together using phasor diagrams to determine their Resultant Phasor or Vector Sum by using the parallelogram law.
Consider two AC voltages, V1 having a peak voltage of 20 volts, and V2 having a peak voltage of 30 volts where V1 leads V2 by 60o. The total voltage, VT of the two voltages can be found by firstly drawing a phasor diagram representing the two vectors and then constructing a parallelogram in which two of the sides are the voltages, V1 and V2 as shown below.
Keep an eye out for more articles on more exciting concepts and calculations that will help you throughout your engineering career.
Interested in our courses?
You can read more about our selection of accredited online electrical and electronic engineering courses here.
Check out individual courses pages below:
Diploma in Electrical and Electronic Engineering
Higher International Certificate in Electrical and Electronic Engineering
Diploma in Electrical Technology
Diploma in Renewable Energy (Electrical)
Higher International Diploma in Electrical and Electronic Engineering
Alternatively, you can view all our online engineering courses here.
Recent Posts
Civil Engineering Courses and Diplomas: Topics, Skills and Career Routes
Civil Engineering Courses and Diplomas: Topics, Skills and Career Routes Introduction Civil engineering is the backbone of modern society. From roads and bridges to skyscrapers and water systems, civil engineers design, build, and maintain the infrastructure that keeps the world running. If you’re considering a civil engineering course or diploma, understanding what it covers is […]
What Is a Diploma in Engineering? Courses, Levels and Career Routes Explained
What Is a Diploma in Engineering? Courses, Levels and Career Routes Explained Introduction Engineering shapes the world around us, from the buildings we live in to the technology we use every day. But for many aspiring engineers, the biggest question is not whether to pursue engineering, but how to start. Traditional university degrees are not […]
Engineering Courses: How to Choose the Right Route for Your Career
Engineering Courses: How to Choose the Right Route for Your Career Introduction Choosing an engineering course can feel like standing at the beginning of several different roads, each leading towards a different kind of future. One route may lead into mechanical systems and manufacturing. Another may lead towards aircraft, infrastructure, electronics, computing, renewable energy or […]