Engineering Projects – Planning for success!
Updated: Jan 26, 2022
Being an engineer is much more than just performing calculations and making drawings. In the real-world, professional engineers are needed to take responsibly for leading projects including planning for time, quality and cost.
In this article, we cover the basics of project planning techniques and common planning tools.
To complete a project successfully you must control a large number of activities, and ensure that they’re completed on schedule.
If you miss a deadline or finish a task out of sequence, there could be knock-on effects on the rest of the project. It could deliver late as a result, and cost a lot more. That’s why it’s helpful to be able to see everything that needs to be done, and know at a glance, when each activity needs to be completed. One commonly used tool to visualise a project plan is a Gantt chart
Gantt Charts
A Gantt chart is a Project Managing Tool, to help you organize your project in a work breakdown structure. It helps you create a schedule for your project and track the status of each task.
Gantt charts convey this information visually. They outline all of the tasks involved in a project, and their order shown against a timescale. This gives you an instant overview of a project, its associated tasks, and when these need to be finished.
There are many different tools and software that can be used to create a Gantt chart, such as ProjectLibre or simply using templates in Microsoft Excel that you can use for free.
Let’s explore further how to create and manage a project management chart (Gantt chart). This can be done in 4 main steps:
Step 1: Identify Essential Tasks
Your project should be broken down into all the tasks that are needed to successfully complete the project.
The first thing you should do is to create a list of all these activities, and estimate how long each task will take.
Let’s use a simple example of making a cup of tea. The tasks involved would be:
| Task Name | Description | Time taken |
| Task 1 | Collect cup | 15 seconds |
| Task 2 | Fill kettle with water | 30 seconds |
| Task 3 | Boil water | 3 minutes |
| Task 4 | Collect tea bag | 15 seconds |
| Task 5 | Collect Milk | 30 seconds |
| Task 6 | Add teabag to cup | 5 seconds |
| Task 7 | Add water to cup and brew | 2 minutes |
| Task 8 | Add Milk | 5 seconds |
Step 2: Identify Task Relationships
Once you have the full list of tasks available, you should start to consider what order these tasks can be performed, and how long each task will take.
In almost all projects, there will be some tasks that can be done in parallel, there will be some task that cannot start until another task has started, and there will be some tasks that cannot start until another job is completed.
Let’s consider the cup of tea example above;
Tasks 1 and 2 can be done independently of each other. i.e. we do not need the kettle to be full before we can collect the cup (and vice versa).
However, Task 2 and Task 3 do have a relationship. That is, we cannot boil the water until we have completed filling the kettle.
Step 3: Input activities into software or a template
As per our example above, you can see that even a very simple task such as making a cup of tea has several steps, with several types of relationships involved. Now imagine scaling that up to a full engineering project, for example the development of a new Aircraft!
It is vital that all the major steps can be easily understood and visualised so that all tasks get completed in the right order and timescale. Don’t forget, any slip to the plan can incur extra costs, so good project management is critical to any project.
At this point, you should also consider any major project milestones (e.g. when is the prototype needed by? What is the promise date for final delivery? ). These milestones are added to the Gantt chart to show major points in the project.
Let’s continue with our cup of tea example: In this example, we have just 1 milestone. The tea should be ready for 7pm! The Gantt chart for this ‘project’ could look like this:
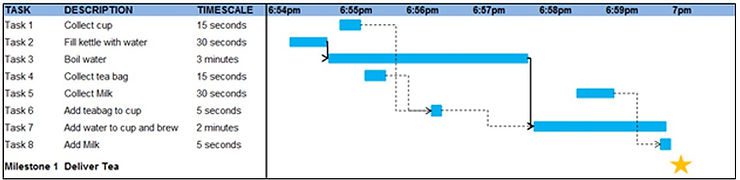
Notice how tasks 2, 3 and 7 (similar for tasks 4&6, and 5&8) are linked together. These tasks must take place in the correct order.
By visualizing the project in the chart above, we now know that we must start the project at 6:54pm in order to make sure the tea is ready for 7pm.
If we start any later, it is impossible to hit our 7pm deadline and the project will overrun. (What we have done here is to identify our critical path, this will be discussed in our next article).
Step 4: Chart Progress
By displaying the project on a Gantt chart, it enables us to keep track of the actual status of the project. For example, each day you can see exactly what tasks should be taking place.
In the real world, quite often as a project moves along it may evolve and change. For example, the delivery of a part may be delayed, therefore you will need to delay the assembly which uses this part. Using the chart type above, it is easy to see what the knock-on effects are to other tasks.
During the lifecycle of the project, you should update your chart to reflect changes as soon as they occur. This will help you to keep your plans, your team, and your customers up to date.
Using a Gantt chart in this way ensures that the true, current status of the project is easily visible, and can be followed by a group of people so that everybody is working on the correct tasks at the correct time.
In the next article we will deep-dive into the analysis of the critical path and what that means to an engineering project.
Interested in electrical and electronic engineering? Find out more about all the electrical engineering courses we have available by clicking here.
Diploma in Electrical Technology
Diploma in Renewable Energy (Electrical)
Diploma in Electrical and Electronic Engineering
Alternatively, you can view all our online engineering courses here.
Recent Posts
The characteristics of basic semiconductors
The characteristics of basic semiconductors In some of our previous articles on Electrical and Electronic Engineering we’ve looked at induction, waveforms and capacitance. We’re now going to move on to looking at semiconductors and how they fit in to these principles. What is a semiconductor? Semiconductors form the basis of all microprocessors and integrated circuits. […]
Trigonometric representation of periodic waveforms.
Trigonometric representation of periodic wave forms While we’ve already looked at periodic wave forms in a previous article, we’re going to jump into the trigonometric representations and see some of the essential calculations we need. Before we jump in, just to refresh our memory, let’s look at an image of two sinusoidal waveforms ‘in phase’: […]
What are the principles of inductance and capacitance?
What are the principles of inductance and capacitance? In our previous article on inductance, we jumped into the behaviour of inductance and what it is. Now we’re going to look at the principles of inductance, as well as the principles of capacitance. Inductance and Capacitance. We’ve already touched on the surface of inductance in our […]