Visual Management Systems: See It, Own It, Improve It
Introduction
All manufacturing companies use Key Performance Indicators (KPIs) in order to provide a fast and visual response to these questions. One of the most simple, but important tools, is a Visual system known as a SQCDP Board.
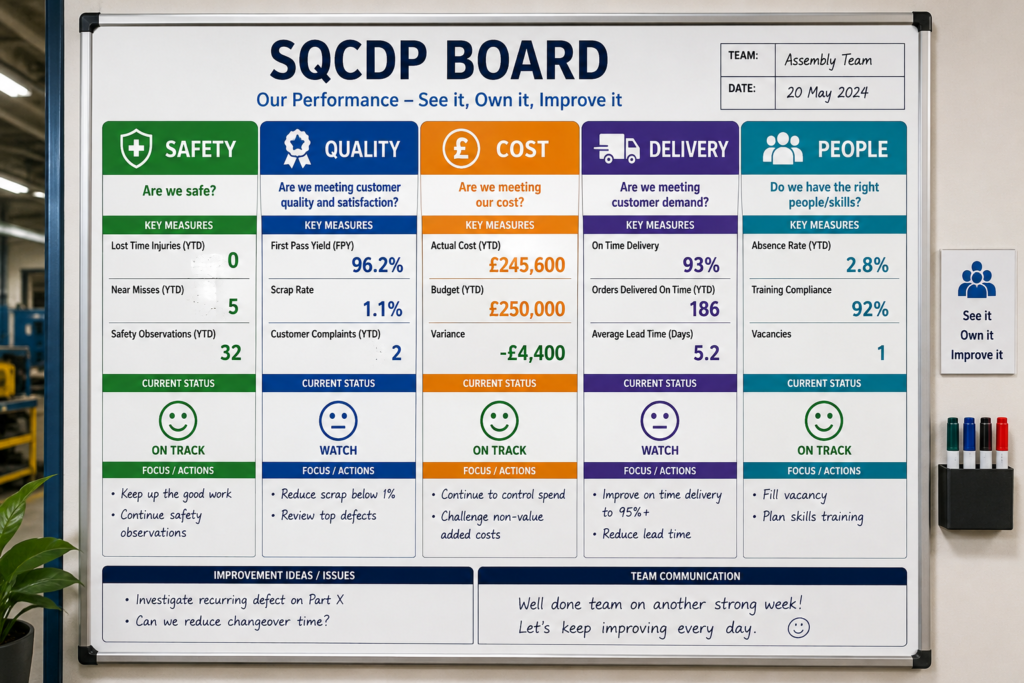
A SQCDP Board is a visual management board which quickly conveys how you are performing in key measures. Specifically, the measures are Safety, Quality, Cost, Delivery, and People. The board should be placed near the team to help collaborate, monitor, and use the information to direct improvement activities.
Almost every measure of a company can be grouped into one of the five headings above. At a very high level, these can be described as:
Safety – How safe is the process/parts for the staff, customers, stakeholders etc. Think: Are we safe?
Quality – How good are the processes/parts. Levels of rework/scrap etc. Think: Are we meeting customer quality and satisfaction?
Cost – How much does it cost? Generally in monetary terms but it could be in the number of hours worked for example. Think: Are we meeting our cost?
Delivery – Generally time bound. How long is it taking to make the part? Think: Are we meeting customer demand?
People – Management of people issues such as holiday and sickness for example. Think: Do we have the right people/skills to perform the job?
Typically a team manager would perform a Start of Shift meeting at the beginning of the shift. This should be a physical meeting located at the board so that any key issues or messages can be given out for the new shift.
Similarly, the team manager may perform an End of Shift meeting at the board at the end of the shift so that the measures can be updated, and any new issues logged on the board.
The image below shows an example SQCDP board in use:
SQCDP boards can be displayed in multiple places throughout a factory in order to give up-to-date information on different areas of the business.
SQCDP at each level.
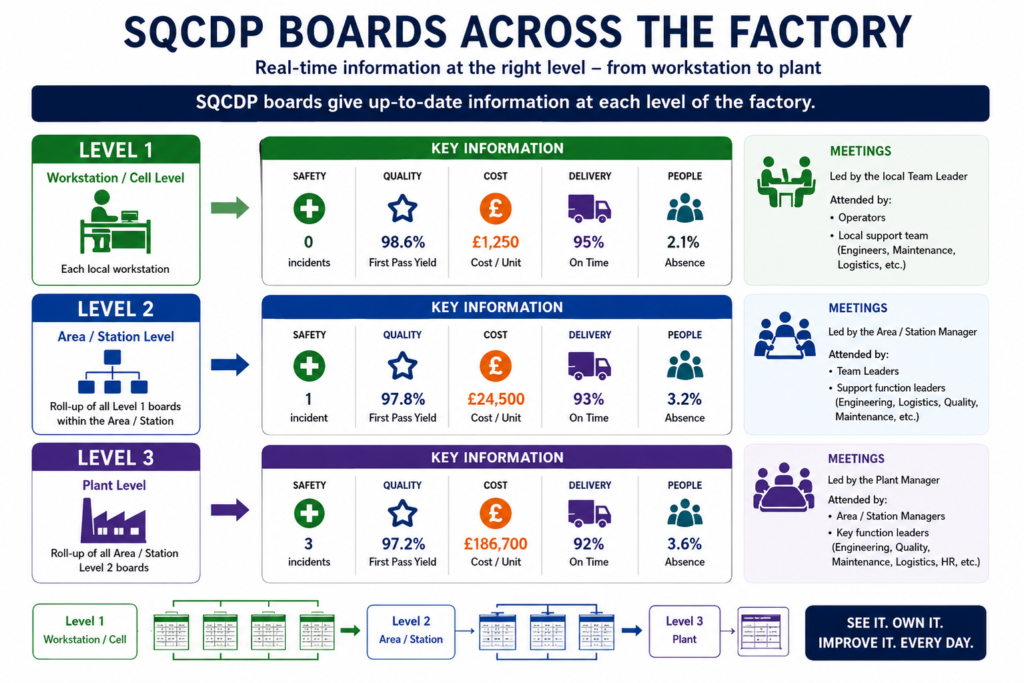
The information should start at:.
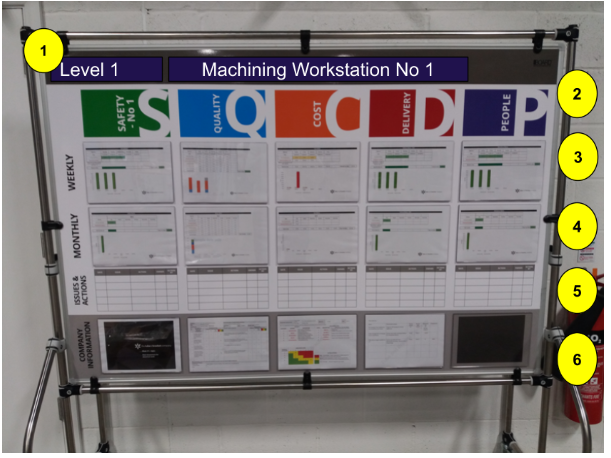
Level 1 – Workstation / Cell Level
Level 1 boards are located at individual workstations or manufacturing cells and display the performance of that specific area. These boards provide frontline operators with immediate visibility of how their process is performing against key targets.
The information shown usually includes:
- Safety incidents, near misses, or hazards
- Quality performance such as defects, scrap, or rework
- Cost measures such as overtime or material waste
- Delivery performance including output versus target or downtime
- People measures such as attendance, training, or staffing levels
The board allows operators and team leaders to quickly identify abnormalities, escalate issues, and agree actions to restore performance.
Meetings at Level 1 are typically:
- Led by the Local Team Leader
- Attended by: Operators, Maintenance support, Manufacturing engineers, Logistics personnel, Other local support functions
These meetings are generally short, focused daily reviews held at the start of a shift or production period. The objective is to review performance, discuss issues, assign actions, and maintain safe and efficient operation within the cell.
Level 2 – Area / Station Level
Level 2 boards are positioned at Area or Station level and consolidate (“roll up”) information from multiple Level 1 boards within that section of the factory.
Rather than focusing on one workstation, the Level 2 board provides an overall view of performance across the wider production area. It highlights trends, recurring problems, capacity constraints, and cross-functional issues that may affect multiple cells.
Typical content includes:
- Aggregated safety performance across the area
- Overall quality trends and customer concerns
- Area cost performance and productivity
- Delivery adherence and schedule attainment
- Staffing, skills coverage, and absenteeism
The Level 2 review helps management identify systemic issues, prioritise resources, and coordinate improvement activity across several teams.
Meetings at Level 2 are typically:
- Led by the Area or Station Manager
- Attended by: Local Team Leaders, Area Engineering Leaders, Logistics Leaders, Quality representatives, Maintenance representatives, Other support function leaders
The focus of these meetings is to:
- Review rolled-up performance from Level 1
- Escalate unresolved issues
- Remove operational barriers
- Coordinate support functions
- Prioritise improvement actions
Level 3 – Plant Level
Level 3 boards operate at plant or factory level and provide the highest operational overview within the SQCDP structure. These boards consolidate performance information from all Level 2 Area or Station boards to present an overall picture of plant performance.
At this level, the focus shifts from local operational issues to broader business performance, strategic priorities, and cross-functional alignment.
The Level 3 board typically includes:
- Plant-wide safety performance and major risks
- Overall quality metrics and customer performance
- Total operational cost and efficiency measures
- Delivery performance against customer demand
- Workforce capability, staffing, and organisational issues
The board enables senior leadership to monitor overall factory health, identify major risks, and ensure that improvement activities are aligned with business objectives.
Meetings at Level 3 are typically:
- Led by the Plant Manager
- Attended by: Area or Station Managers, Heads of Engineering, Heads of Logistics, Heads of Quality, Heads of Maintenance, HR representatives, Other functional leaders
These meetings are used to:
- Review overall plant performance
- Escalate critical operational issues
- Align departments on priorities
- Allocate resources
- Drive strategic continuous improvement activities
Depending on the size and complexity of the company, you may have more or less levels, but 3 is a typical format.
Typical SQCDP Measures
So what exactly is measured on a SQCDP board? Well this will be different for every company, and may even be different at each workstation within a company. The whole point of the board is to display information that is relevant to that specific level and business area.
However some typical metrics and possible targets are given below:
Each SQCDP board contains a number of key measures and targets that help teams understand whether the operation is performing effectively. These measures are grouped under the five SQCDP categories: Safety, Quality, Cost, Delivery, and People. The information is designed to be simple, visual, and easy to review during daily team meetings so that issues can be identified quickly and improvement actions agreed immediately.
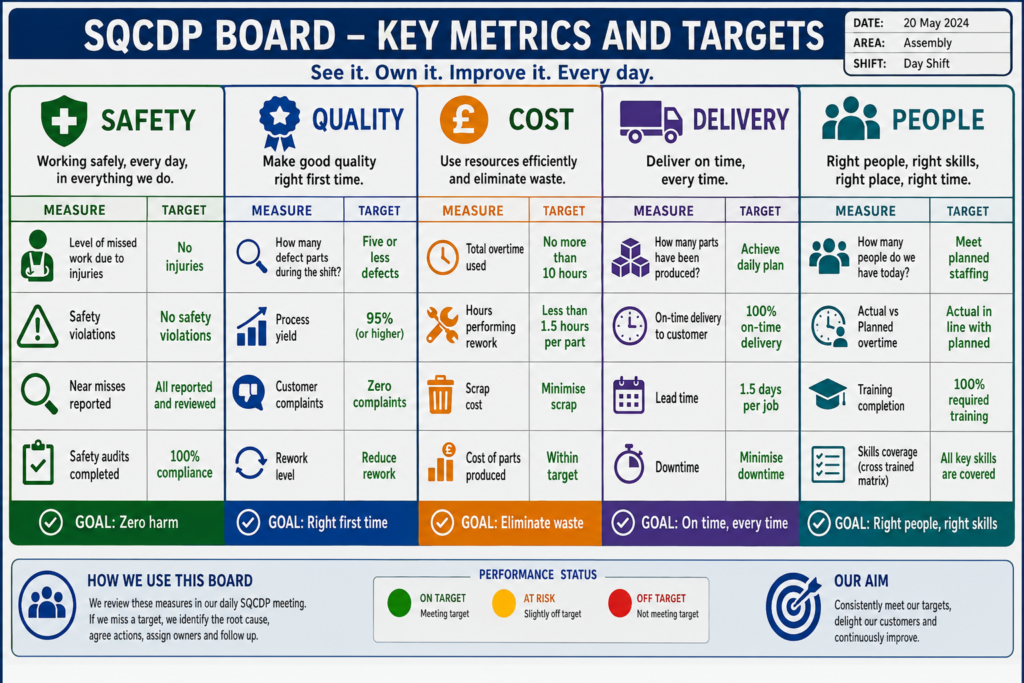
The Safety section focuses on protecting employees and ensuring that work is carried out in a safe and controlled manner. Typical measures may include the number of injuries, near misses, or safety violations that occur during a shift. Many organisations set a target of zero injuries and zero safety violations, reinforcing the principle that all accidents are preventable. By reviewing safety performance daily, teams are encouraged to identify hazards early and maintain a strong safety culture across the workplace.
The Quality section measures how well the process or product meets customer requirements. This often includes tracking the number of defects produced during the shift, the level of scrap or rework, and the overall process yield. For example, a team may aim to produce no more than five defects per shift while maintaining a process yield of 95% or higher. Monitoring quality performance in real time allows problems to be identified quickly so that corrective action can be taken before customer satisfaction is affected.
The Delivery section focuses on whether production is meeting customer demand and schedule requirements. Measures typically include the number of parts produced, production versus target, on-time delivery performance, and overall lead time. A common target may be to achieve 100% on-time delivery to the customer while maintaining a lead time of 1.5 days per job. These measures help teams understand whether production flow is stable and whether customer expectations are being met consistently.
The Cost section measures operational efficiency and the effective use of resources. This may include monitoring overtime usage, rework hours, scrap costs, or labour efficiency. For example, an organisation may set a target of using no more than 10 hours of overtime while ensuring that rework activity remains below 1.5 hours per part. Reviewing cost performance regularly helps identify waste within the process and supports continuous improvement activities aimed at reducing unnecessary expenditure.
The People section focuses on workforce capability, attendance, and skills coverage. Teams may monitor staffing levels, overtime usage, training completion, and the availability of critical skills within the area. Typical targets could include ensuring that actual overtime remains aligned to planned overtime and that all key skills are covered within the cross-training matrix. This helps ensure the operation has the right people available with the necessary skills to maintain safe and efficient production.
Together, these measures provide a balanced view of operational performance. The purpose of the SQCDP board is not simply to display data, but to encourage daily communication, accountability, and problem solving. When targets are not achieved, the team can immediately discuss the issue, identify root causes, and agree actions to restore performance and support continuous improvement.
Pass / Fail
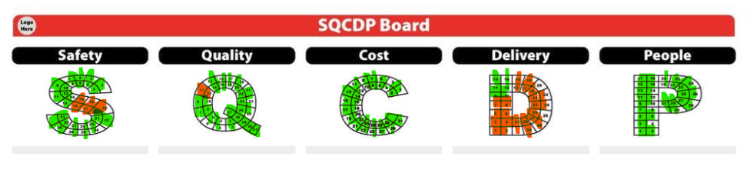
Another popular management measure is to use a very simple Red/Green colour to indicate whether the area is a Pass or Fail against each target measure. The image below shows one popular method for doing this:
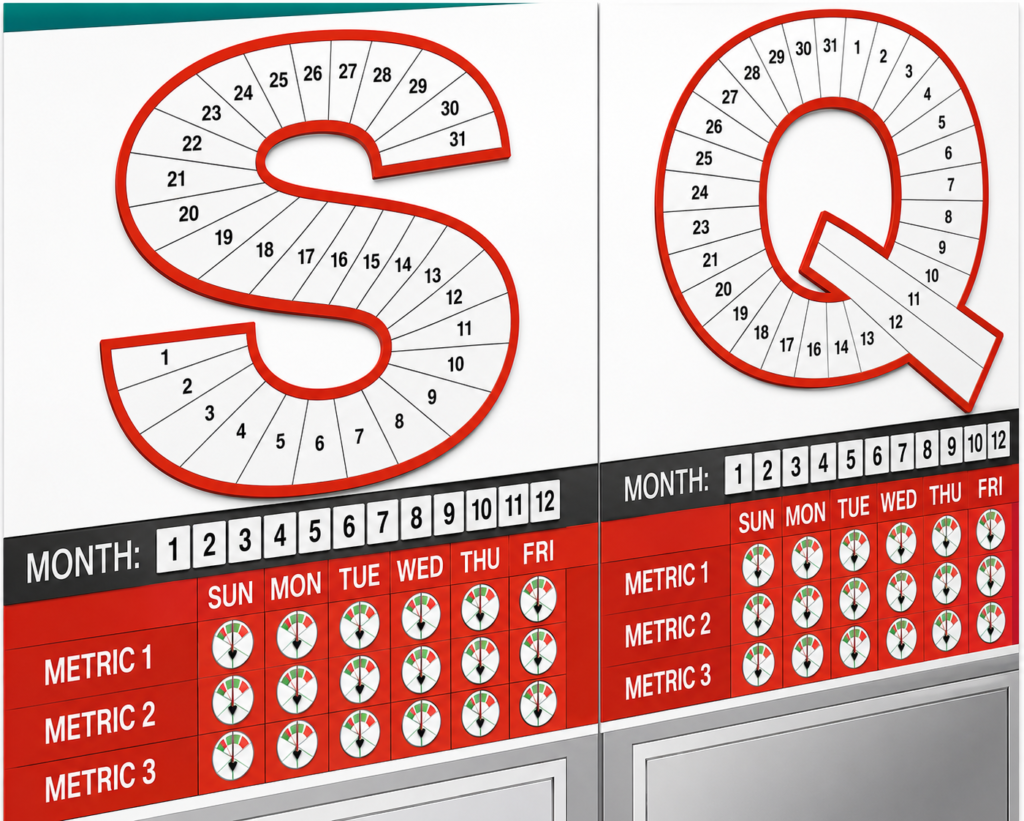
Each of the letters S,Q,C,D and P are actually split into the number of days in a month. At the End of Shift meeting, the team leader can then physically colour the relevant shift in Red or Green depending on if it is a Pass or Fail against that relevant metric.
By doing this, you get a very quick visual display on how that station is performing; for example, imagine seeing the board below:
We do not need to know any details about how the station works, but straight away we can instantly see that this area has a problem with delivery as it is Red for 28 out of 30 days in that month. Straight away we know that even though the parts are generally good quality (29/30 green days) and good cost, they are almost always being delivered late.
Imagine walking around a factory with an SQCDP board at every stage.
You can now see how powerful the SQCDP board can be. It instantly allows anybody, whether that be an operator, the company CEO, a visitor, or even a customer to very quickly see how the business is performing without needing to understand the technical details behind each workstation.
Benefits
Successfully implementing Visual Management will come with a number of benefits including:
Evaluate trends – At a glance one can see which areas are succeeding, and which need support. If a team says changes have been made, but the red continues, further action can be taken.
Improve Productivity – Keep your workforce organised and productive and prevent slipping back into Business as Usual.
Improves Accountability - With a daily guide to where errors are occurring and standards are not being met, accountability is easily assigned to one area. If the Board is in a public space, then this can be incentive enough for a team to work smarter and start achieving goals/targets.
Promote Values – Enact your values and make them part of the culture of your working environment.
Impress Clients – Display to your Visitors that you’re invested in continuous improvement and have established performance standards.
Interested in our Industrial & Manufacturing Engineering Courses?
At iLearn Engineering®, we offer a diverse range of online accredited Industrial, Manufacturing and Mechanical Engineering courses and qualifications to cater to different academic and career goals. Our industrial courses are available in varying credit values and levels, ranging from 40 credit Engineering Diplomas to a Bachelor’s equivalent 360 credit International Graduate Diploma.
All Industrial / Manufacturing Engineering Courses
All Industrial / Manufacturing Engineering Diploma Courses can be seen here.
All Mechanical Engineering Diploma Courses can be seen here.
Short Courses for Industrial Engineering (40 Credits)
- Diploma in Manufacturing
- Diploma in Composites, Smart Materials & Nanotechnology
- Diploma in Lean Manufacturing
- Diploma in Mechanical Technology
- Diploma in Electrical Technology
- Diploma in Material Science
First Year of Undergraduate (Level 4 – 120 Credits)
Higher International Certificate in Industrial Engineering
Higher International Certificate in Mechanical Engineering
Years One and Two of Undergraduate (Level 5 – 240 Credits)
Higher International Diploma in Industrial Engineering
Higher International Diploma in Mechanical Engineering
Degree Equivalent International Graduate Diplomas in Engineering Management and Mechanical Engineering (Level 6 – 360 Credits)
International Graduate Diploma in Engineering Management (Level 6) [120 Credit Top Up]
International Graduate Diploma in Mechanical Engineering (Level 6) [120 Credit Top Up]
Complete Engineering Course Catalogue (all courses)
Alternatively, you can view all our online engineering courses here.
Get started today
Explore our range of Industrial and Manufacturing Engineering courses
Recent Posts
5S and Lean Manufacturing: Building Efficiency from the Ground Up
5S and Lean Manufacturing: Building Efficiency from the Ground Up Introduction Lean manufacturing is built on the principle of eliminating waste while maximizing productivity, quality, and efficiency. However, before any lean strategy can deliver lasting results, organizations need a strong operational foundation, and that foundation begins with 5S. The 5S methodology is more than just […]
Kaizen and Continuous Improvement: Benefits, Challenges, and Impact
Kaizen and Continuous Improvement: Benefits, Challenges, and Impact Introduction Continuous improvement is a management philosophy focused on making ongoing, incremental improvements to processes, products, and workplace culture. One of the most recognised approaches to continuous improvement is Kaizen, a Japanese philosophy meaning “change for the better.” Developed and popularised in Japanese manufacturing industries, particularly Toyota, […]
The Toyota Way and the Foundations of Lean Manufacturing
The Toyota Way and the Foundations of Lean Manufacturing Introduction Lean manufacturing is a living system, which interconnects every entity and person from the organisation to deliver value to the customer. Lean manufacturing is based on the Toyota Production System. Toyota started as a small automobile manufacturing company of the Toyoda family, during World War […]