How can we select engineering materials?
In our previous article, we looked at elastic and magnetic hysteresis. In this article, we’re going to look at how we can select engineering materials. In other articles, we have previously looked at the different materials and their properties. However, it’s important that engineers understand how we can go about picking the correct material for our engineering application.
Material selection charts
These charts are a graphical way of representing material data. As the majority of mechanical properties range of several orders of magnitude, the charts are produced with a logarithmic scale.
The image below shows an example chart for Young’s modulus versus density for certain material families, such as ceramics, wood, metals and so on:
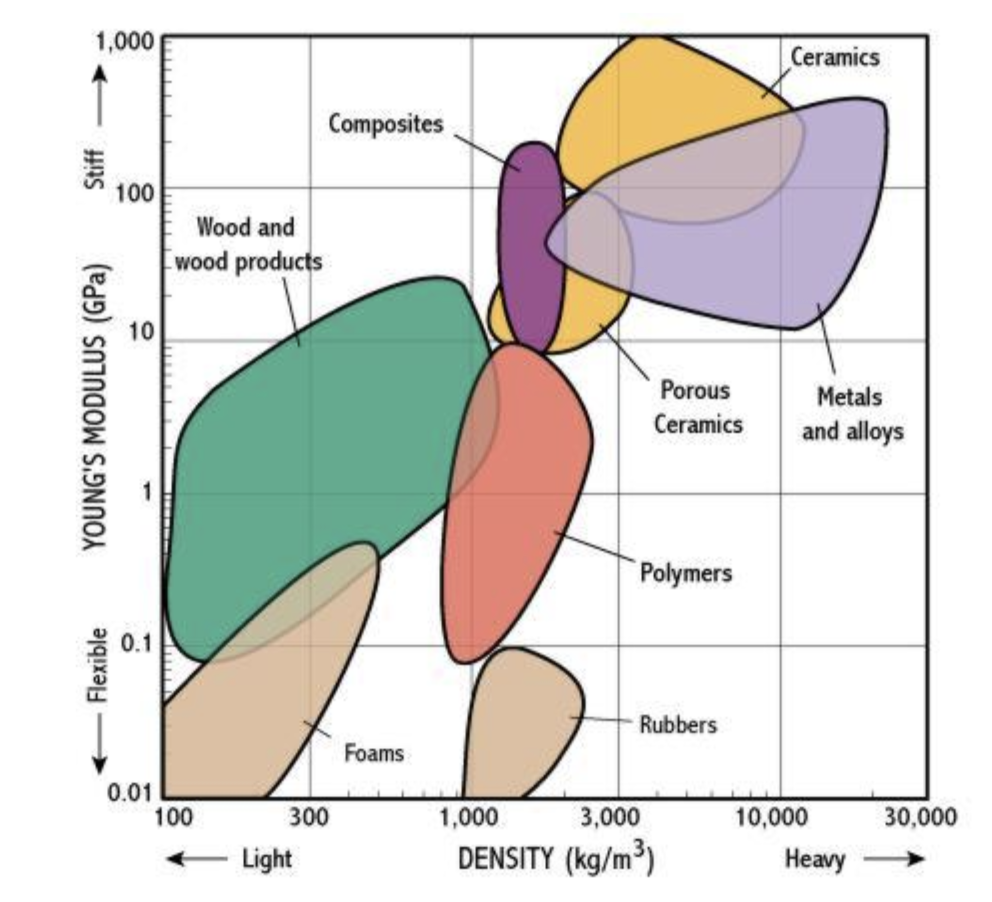
On the Y-axis, you can see that the values for Young’s modulus are given in GPa. With a logarithmic scale being used, a wide range of values from 0.01GPa (10MPa), i.e. very flexible materials, all the way through to 1000GPa (very stiff materials) can easily be shown.
On the x-axis we have material density, going from light materials through to heavy materials. Each coloured ‘bubble’ represents a whole material family, so we can quickly see how different materials types measure. For example, it is no surprise to see that wood and wood products are generally lower density (and therefore weight) than metals and alloys.
Each ‘bubble’ can then be further split down to show the individual material properties within that classification. For example, the Young’s modulus vs density chart is now shown with metals and polymers expanded into more detail:
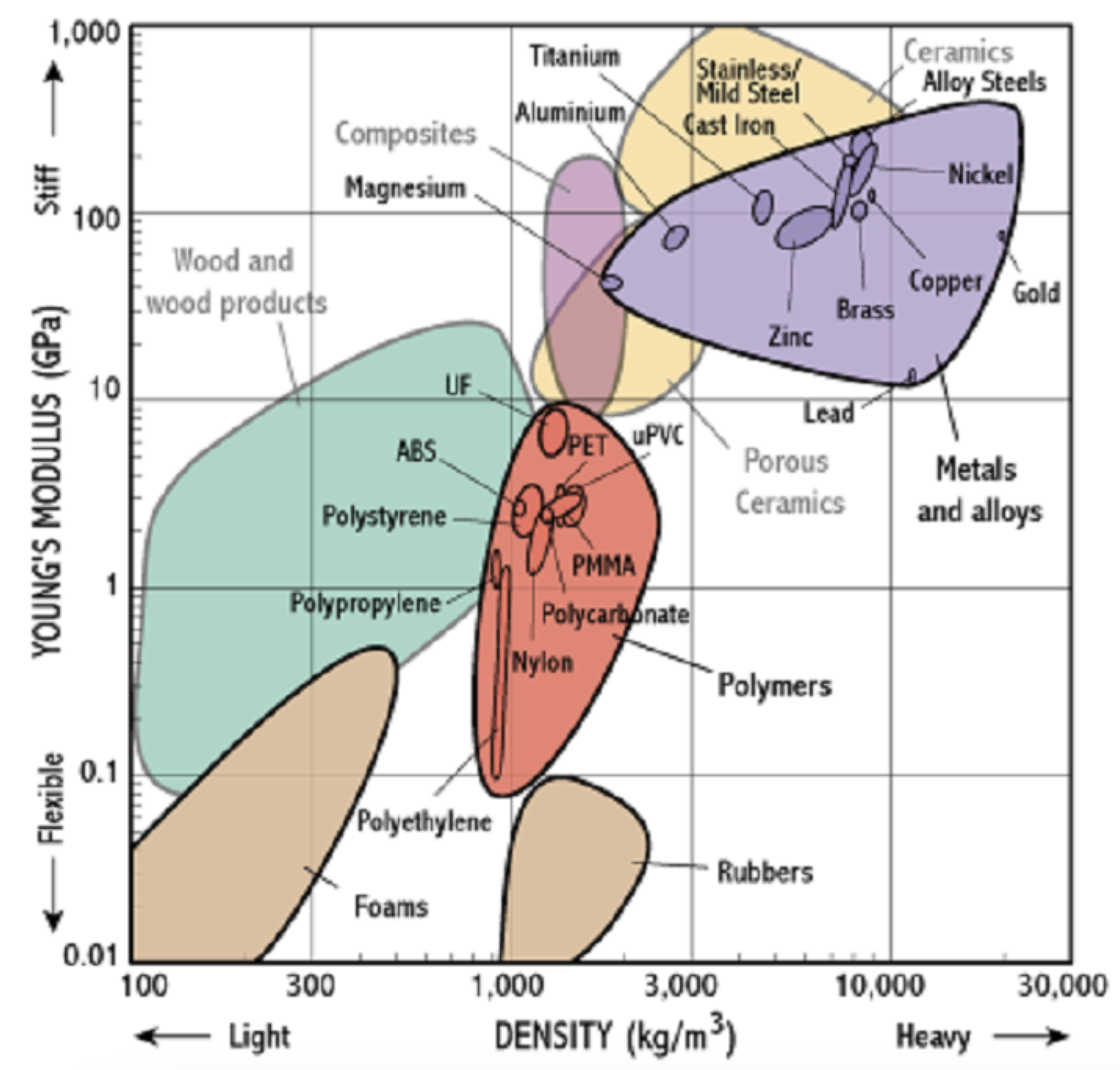
It’s worth noting how each specific material takes up a much smaller ‘bubble’, so now the chart starts to become much more useful for material selection purposes, and engineers can dive a lot deeper into selecting a specific material, for example copper rather than a generic ‘metal’.
Engineering designers have a challenging task in choosing the appropriate material for any given product. It is common for them to have to consider many competing objectives and constraints at once – light and stiff, strong and cheap, tough and recyclable (or maybe all of these at once!). Material selection in design is therefore a matter of assessing trade-offs between several competing requirements, and the material selection charts help to visualise these trade-offs, making it a lot easier for engineering designers to visualise how various materials might affect their design. This makes it a lot easier to select an appropriate material overall.
Keep an eye out for our next articles looking at basic electrical parameters and how we calculate them.
Interested in our courses?
You can read more about our selection of accredited online mechanical and industrial engineering courses here.
Check out individual courses pages below:
Higher International Diploma in Mechanical Engineering
Higher International Certificate in Mechanical Engineering
Diploma in Mechanical Engineering
Diploma in Mechanical Technology
Higher International Diploma in Industrial Engineering
Higher International Certificate in Industrial Engineering
Diploma in Engineering Management
Alternatively, you can view all our online engineering courses here.
Recent Posts
Civil Engineering Courses and Diplomas: Topics, Skills and Career Routes
Civil Engineering Courses and Diplomas: Topics, Skills and Career Routes Introduction Civil engineering is the backbone of modern society. From roads and bridges to skyscrapers and water systems, civil engineers design, build, and maintain the infrastructure that keeps the world running. If you’re considering a civil engineering course or diploma, understanding what it covers is […]
What Is a Diploma in Engineering? Courses, Levels and Career Routes Explained
What Is a Diploma in Engineering? Courses, Levels and Career Routes Explained Introduction Engineering shapes the world around us, from the buildings we live in to the technology we use every day. But for many aspiring engineers, the biggest question is not whether to pursue engineering, but how to start. Traditional university degrees are not […]
Engineering Courses: How to Choose the Right Route for Your Career
Engineering Courses: How to Choose the Right Route for Your Career Introduction Choosing an engineering course can feel like standing at the beginning of several different roads, each leading towards a different kind of future. One route may lead into mechanical systems and manufacturing. Another may lead towards aircraft, infrastructure, electronics, computing, renewable energy or […]